AppSphere is AppDynamics’ annual conference, which brings together 2,000+ customers, partners, and prospects interested in gaining a competitive advantage through application intelligence insight and education.
Following are my top 10 Takeaways from the conference:
1) WHY APM : Applications themselves are becoming increasingly difficult to manage as they move toward highly distributed, multi-tier, multi-element environment setup and its dependency on application development frameworks such as .NET or Java.
2) There is a need to monitor the applications, business transactions, End-users in real time production environment and analyze the data produced to enhance productivity, user experience and anticipate failure scenarios before they actually occur.( More proactive than reactive)
3) Five dimensions of APM (Application performance monitoring)
- End User Experience monitoring (study user journey, flow breaks)
- Runtime application architecture discovery, Modeling and display.
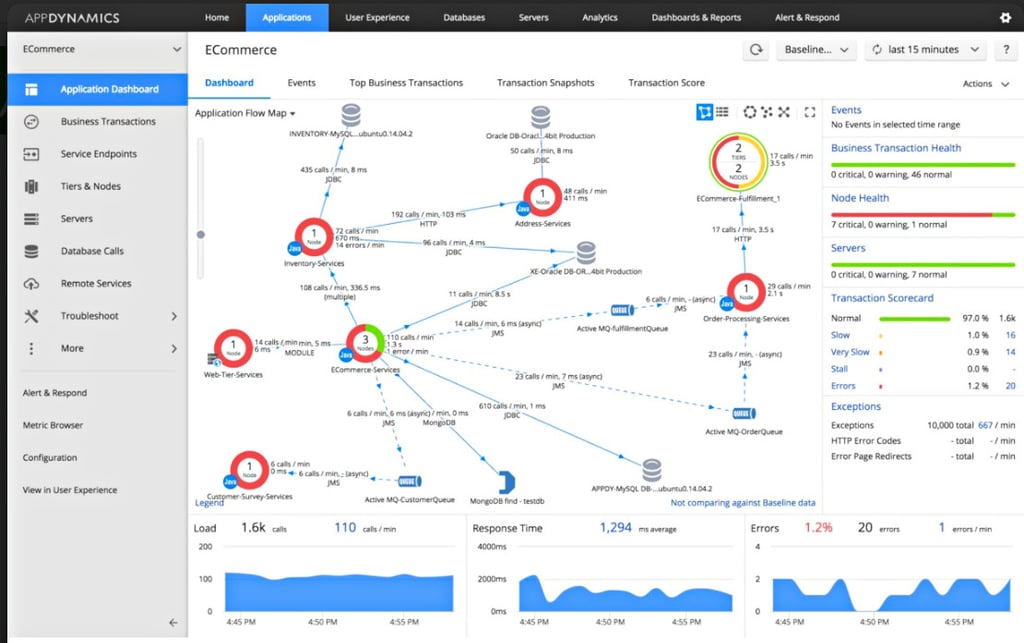
- Business transactions (User defined transactions, code visibility, Flow-maps)
- Component deep dive monitoring in application context
- Analytics
4) End User Experience Monitoring:
- Browser RUM : Using browser real-user monitoring we can follow the user journey and optimize the experience with powerful end-to-end performance management that rapidly identifies application issues and relevant business transactions, and dramatically reduces MTTR
- Mobile RUM : Track mobile user sessions in real-time and understand the business impact of mobile app performance
- Browser Synthetic monitoring : Proactively ensure application performance and availability anytime from around the world with browser synthetic monitoring.Measure entire multi-page workflows simulating a complete customer journey including form data submission and user-actions via Selenium based scripting of tests.
5) Application monitoring (Java):
- Helps in understanding health of JVM with key Java tuning and profiling metrics, including: response times, throughput, exception rate, garbage collection time, code deadlocks, and more.
- Logging just helps to do RCA after an error has occurred but features like ALD (Automatic Leak Detection) and OIT (Object Instance Tracking) help prevent a lot of errors from occurring. AppDynamics also provides baseline performance to alert and address emerging issues in context of Business Transactions, before they actually occur.Thread Contention Analyzer monitors the thread state as well.
- Displays flow maps which further help isolate and resolve production java application performance issues all up to the code-level with minimal overhead.
6) Business iQ : Application Analytics enables us to do real-time analysis of business performance and find answers to questions like How many users experienced failed checkout transactions in the last 24 hours? How much revenue was lost because of these failures? How is that revenue distributed across different product categories etc.
- Different types of supported analytics features are Transaction Analytics, Log Analytics, Browser and Mobile Analytics & Custom Analytics Events.
- Ability to pass custom user data to build reports and dashboards.
7) ADQL AppDynamics Query Language is a query language for searching data available in Application Analytics. ADQL is similar to the ‘SELECT’ statement in the widely used Structured Query Language (SQL) but is designed specifically for AppDynamics Analytics data such as transaction events, EUM events, or logs, a list of fields to retrieve, and conditions for selecting events from the analytics data store.ADQL has recently got some new additions to its Math library as well.
8) Micro-services iQ: Micro-services is a growing trend where complex applications are being broken into smaller services. The Service endpoint views help us to measure specific micro-services performance communicating asynchronously.Its supports for modern languages and an open-ended platform allows for easier metric and log ingestion across technologies selected by different teams.
9) Database Monitoring: To monitor your databases and database servers for situations where load is too high, response time is too slow, number of executions of a SQL queries are too high, or disk capacity is too low.
10) Dashboards: The dashboards are precise and feature rich with events on charts, Image widgets handling Base64 encoded images, Graph widget backed by query to gather the required data, baseline to make sure that everyone sees data in proper context. e.g Higher management and DevOps see the same data, differently within their respective context.
In addition to the tech aspect, there were some interesting thoughts about innovation around s/w product development:
- Be very strategic to what data you want and use it quickly for your betterment. DevOps is the key to this.
- Be disruptive, fail fast and believe in what you do!
- Prime focus should be to create a seamless experience for your customers.
- Be Innovative..there is no option
- Experiment, Release & Analyze.The metric to roll out experimental builds (Canary groups) be directly proportional to “How much you want to apologize if you mess up !”
- Security, authentication, voice auth, IOT, AR/VR would be the future areas of innovation.
No wonder, Gartner ranks App Dynamics#1, market leader.