In an earlier posting we saw how ranking resumes can save time spent by recruiters and hiring managers in the recruitment process. We also saw that it lends itself well to lean hiring by enabling selection of small batch sizes.
Experiment – Manually Ranking Resumes
We developed a game for ranking resumes by comparing pairs with some reward for the winner. The game didn’t find the level of acceptance we expected it to find. So we enlisted a human expert to do the ranking. It took half a day for an experienced recruiter to rank 35 resumes. Very often the recruiter asked which attribute was to be given higher weightage? Was it experience, location, communication or compensation?
These questions indicate that every time we judge a candidate by his resume, we assign some weightage to various profile attributes such as experience, expected compensation, possible start date, etc. Every job opening has its own set of weightages, which are implicitly assigned as we try to compare the attributes of a resume with the requirements of the job opening.
So the resume-ranking problem essentially is reduced to finding the weightages for each of the attributes.
Challenge – Training Set for standard ranking algorithms
Many algorithms are involved to solve the ranking problem. Most of the ranking algorithms fall under the class of “Supervised Learning” which would need a training set consisting of resumes graded by an expert. As we saw earlier, this task is quite difficult as the grade will not only depend on the candidate profile but also on the job requirements. Moreover, we can’t afford the luxury of a human expert training the algorithm for every job opening. We have to use data that is easily available without additional efforts. We do have some data from every job opening as hiring managers screen resumes and select people for interviews. It’s easy to extract this data from any ATS (Applicant Tracking System). Hence we decided to use “Logistic Regression” that predicts the probability of a candidate being shortlisted based on the available data.
We have seen that “Logistic Regression” forecasts the probability based on weightages for various attributes learned from which resumes were shortlisted or rejected in the past. This probability – in our case – would indicate if the candidate is suitable or not. We would use this number to rank candidates in descending order of suitability.
Available Data
In our company, we had access to data of the following 13 attributes for approximately 3000 candidates who were screened for approximately 100 openings over the last 6 months.
-
Current Compensation
-
Expected Compensation
-
Education
-
Specialization
-
Location
-
Earliest Start Date
-
Total Experience
-
Relevant Experience
-
Communication
-
Current Employer
-
Stability
-
Education Gap
-
Work Gap.
We needed to quantify some of these attributes such as education, stability, communication, etc. We applied our own judgment and converted the textual data to numbers.
Data Cleaning
We were unsure if we would get consistent results as we were falling short of historical data of resumes. We ignored openings that had 10 or less resumes screened. On the other hand, we also discovered a problem with large training sets – particularly in the case of job openings that remain open for long. These job openings are likely to have had a change of requirements. As we learned later, consistent accuracy was obtained for job openings having training sets whose population was in the range of 40 to 80 resumes.
Running Logistic Regression
We had listed 22 openings for which several hundred resumes were presented to the hiring managers in the last 6 months. We maintained a record of interviews scheduled based on suitability of the resumes. We decided to use 75% of the available data to train (Training Set) and 25% to test (Test Set) our model. The program was written to produce the following output:
-
Vector of weightages for each one of the 13 attributes
-
Prediction whether the set of test cases would be “Suitable” or “Unsuitable”
The result was based on the accuracy of the prediction. Accuracy is defined as the following formula:
Accuracy = (True Positives + True Negatives) / (Total # of resumes in the Test Set)
“True Positives” is the number of suitable resumes correctly predicted to be suitable. Similarly “True Negatives” are the number of unsuitable resumes predicted to be unsuitable. We achieved average accuracy of 80% ranging from 67% to 95%.
Efforts to improve accuracy
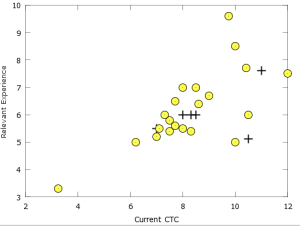
A Plot of suitable and unsuitable resumes on Experience vs Pay didn’t show any consistent pattern. The suitable resumes tended to be more of highly paid individuals who had lower experience, which is somewhat counterintuitive. Other than this, the suitable resumes tended to cluster closer to the center of the graph as compared to the unsuitable ones.
Given the nature of the plot, the decision boundary would be non linear – probably a quadratic or higher degree polynomial. We decided to test using a 6th degree polynomial – thus creating 28 attributes from 2 main attributes – viz. experience and pay. We ran the program again; this time with these 28 sixth degree polynomial and remaining 11 attributes thus a total of 39 attributes. This improved the accuracy from 80% to 88%. We achieved 100% accuracy for 4 job openings.
Regularization had no impact on accuracy. Hence we didn’t use any cross validation set for testing various values of the regularization parameter.
Values of weightages or parameters varied slightly each time we ran the program to find the minimum of the cost function. This indicates that the model found a new minimum in the same vicinity every time we ran the program with no changes to the training set data.
Some Observations
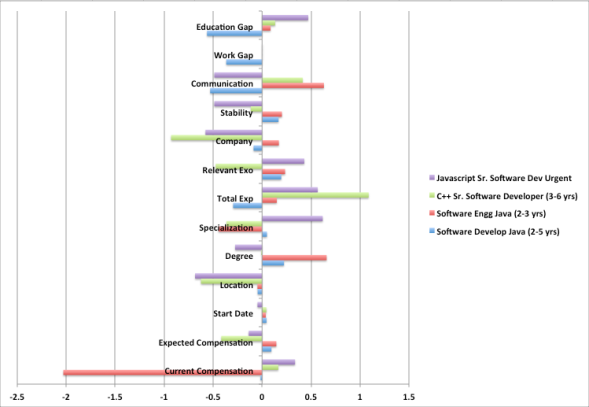
Taking a close look at the chart above, we observe the following:
-
One job opening gives extremely negative weightage to “Current Compensation” – this means that higher paid candidates are not suitable. Interestingly, the opposite is the case for most other job openings.
-
C++ Developer position assigns positive weightage to “Total Experience” but negative weightage to “Relevant Experience”. The requirement was for a broader skillset beyond just C++.
We can continue verifying the reasons for what turns out to be a fairly distributed set of values for weightages for various attributes. Each job opening has pretty much independent assessment of the resumes and candidates.
As expected we observed that accuracy generally increases with sample size or size of the training set. As previously mentioned, accuracy was reduced in the case of job openings that remained open for long periods of time and the selection criteria underwent change.