Launching a product is hard, and sustaining it is even harder! Getting the right feedback from your users is critical in maintaining that competitive advantage. Happier users form an integral part of your product. These satisfied users have more affinity with your product, are likely to help you make it better, and possibly buy additional products from you in the future.
A crucial part of getting this critical feedback is user behavior analysis. Product owners often want to see how a user uses the product. Analyzing such behavior over a cohort of users helps owners understand the exact set of features they need to build to sustain and grow.
In Part 1, we introduce User Behavior Analysis (UBA) and how to get data to guide your decisions.
Advantages of User Behavior Analysis
UBA has several advantages. It can help product owners verify and validate their hypothesis on how the product adds value to users. Owners can use data from the UBA to understand if a product does indeed solve a challenge that the user faces.
It can also help owners see how a specific user need changes over time. The underlying product usage data can help them foresee these changes and adapt the product accordingly. These data-guided decisions make life a lot easier for product owners in securing additional funding and management buy-in.
User Behavior Analysis can also help product owners understand if there are opportunities for adjacent and ancillary products. These products can make the overall portfolio more productive. These can also unearth untapped revenue opportunities.
Identifying the right tools
Depending on what the product is and how it is available to users, several tools exist that can for collecting data and analyzing user behavior. A summary of these tools is as shown below. Using the right tool for the right need makes the process of UBA successful.
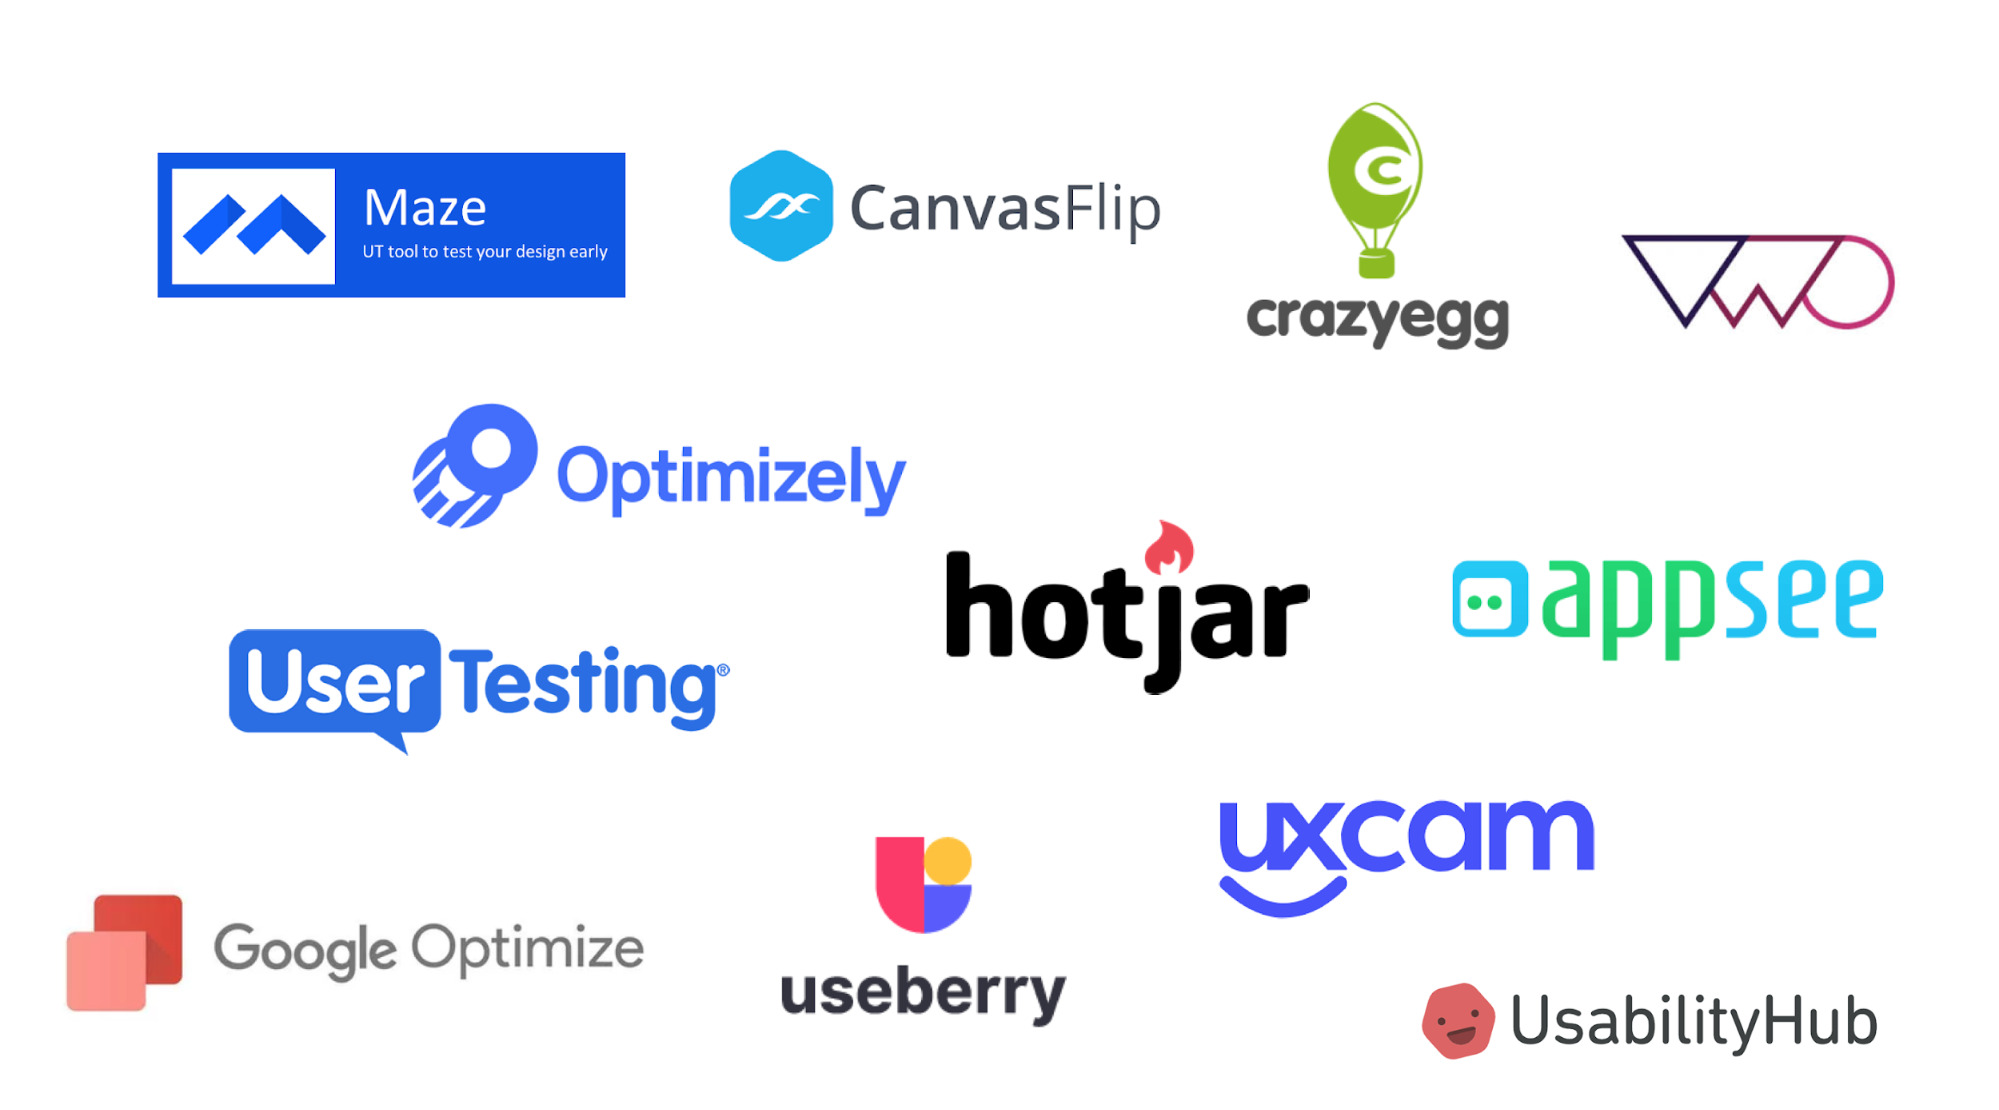
More often than not, the product stage dictates tool selection.
Early-stage products use card sorting for testing and validating their information architecture. Wireframes and prototypes use tools such as Maze and Invision are being deployed. Getting feedback from live products is made possible by tools such as Hotjar, Crazyegg, and Optimizely. Mobile apps commonly use tools such as Appsee and the most widely used amongst all is Google Analytics.
For more advanced features such as eye-tracking devices and software such as Mr. Tappy, Noldus and Xlabs are available.
Analyzing tool data
Let’s take Hotjar as a test tool and see the kind of analysis it can provide. With every tool, the process of collecting and analyzing data might vary; however, the end goal of the study remains the same.
Below are the core features of Hotjar, that must be present in every UBA test report.
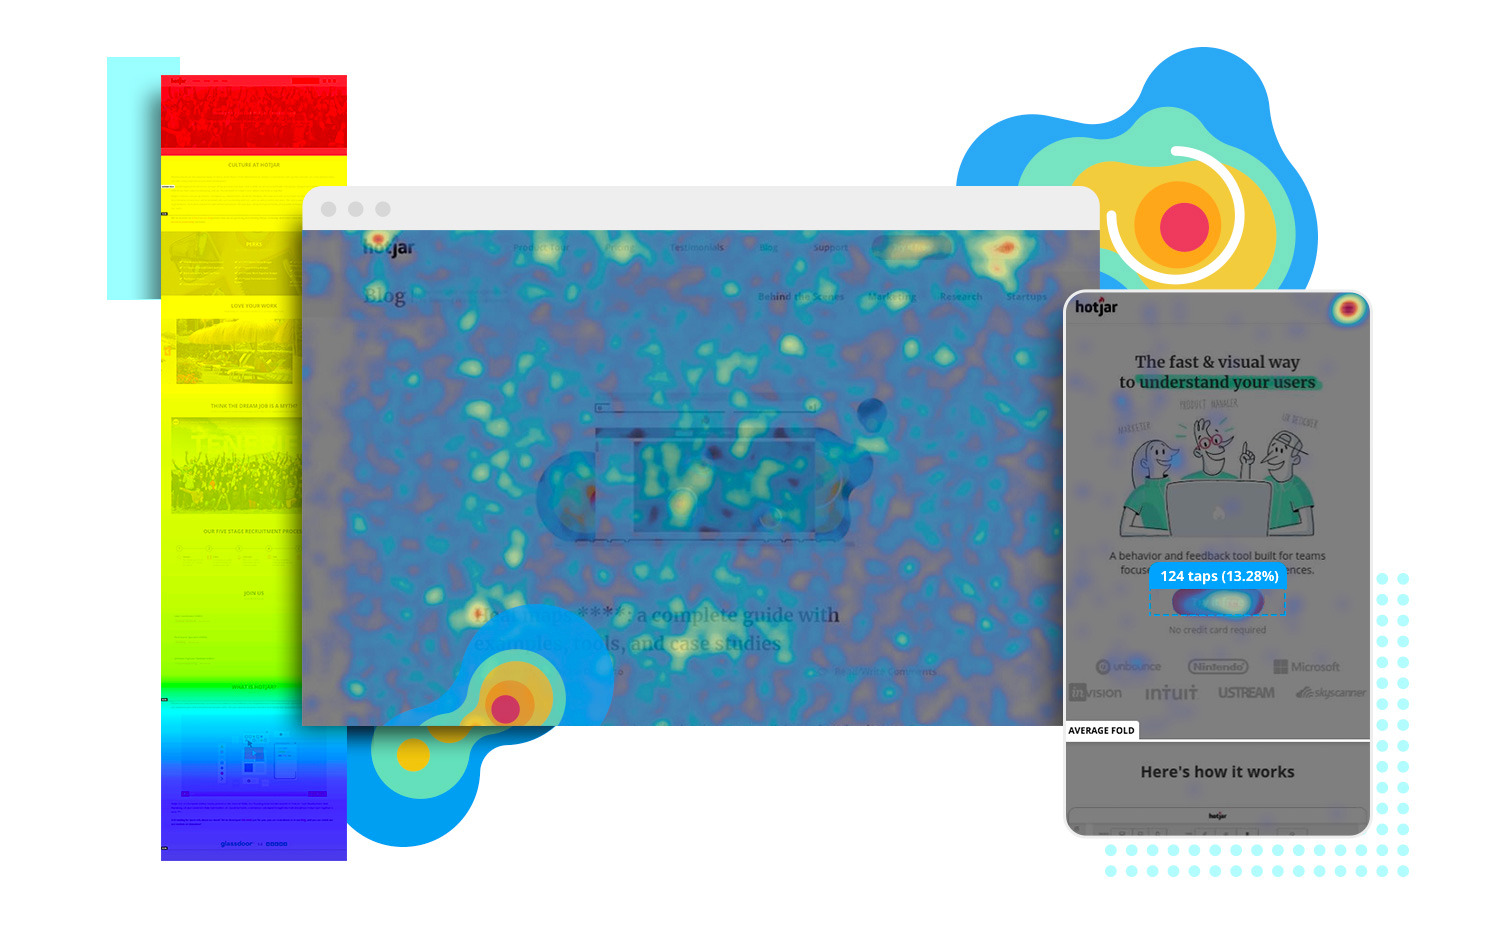
Heatmaps
Heatmap is a graphical representation of data that shows the most popular and unpopular elements of a page. It works on all types of devices.
Three major types of heatmaps exist,
- Scroll map: To understand how far in the page the users will scroll down to
- Move map: Track the users’ mouse pointer movement
- Click map: To see the most prominent areas of the page where user clicks exist
Heatmaps help product owners understand the following,
- Sections of the product the user is actively spending time on and what they are looking at more
- If the users are clicking on the right elements or are getting confused with non-clickable elements
- Distractive elements that take the user away from the intended path
- If the user facing issues on other devices
We can generate UBA Heatmap reports for each and every page of the product. Let’s not burden yourself by unwanted data, go wisely and just focus on the specific pages like Homepage and Landing pages, New Pages, Top Pages, Under-performing Pages.
Recordings
Recordings help owners understand specific user actions on a task or a page (Hotjar does not record any user credentials or valuable and confidential content).
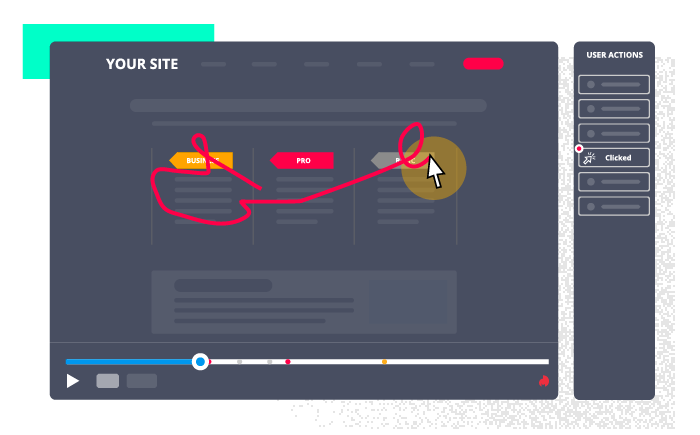
It captures mouse movements, clicks, taps, and scrolling elements across multiple pages. This recording helps identify bugs, issues, obstacles, and understand points of friction while using the product. Heatmaps also help understand user demographics, click history, and the time it takes to complete a specific task.
Defining goals and mapping the collected data against these goals help owners make data-guided decisions.
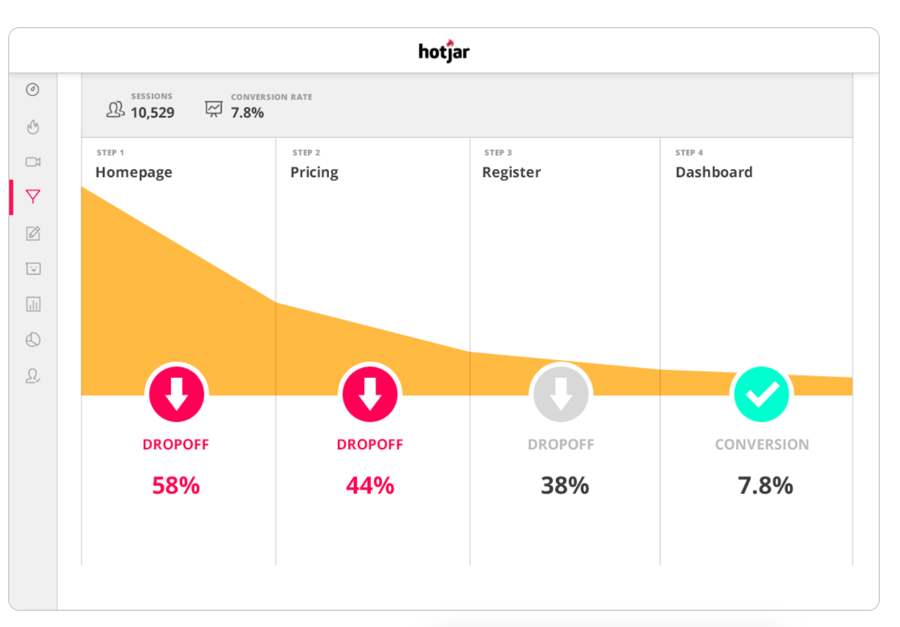
Conversion Funnels
Funnels are a great way to segment your users based on their intent and affinity towards your products. They help understand why users drop off after a particular stage, identify problem areas, understand how the conversion happens. Funnels also provide insight into why users sometimes completely abandon your product.
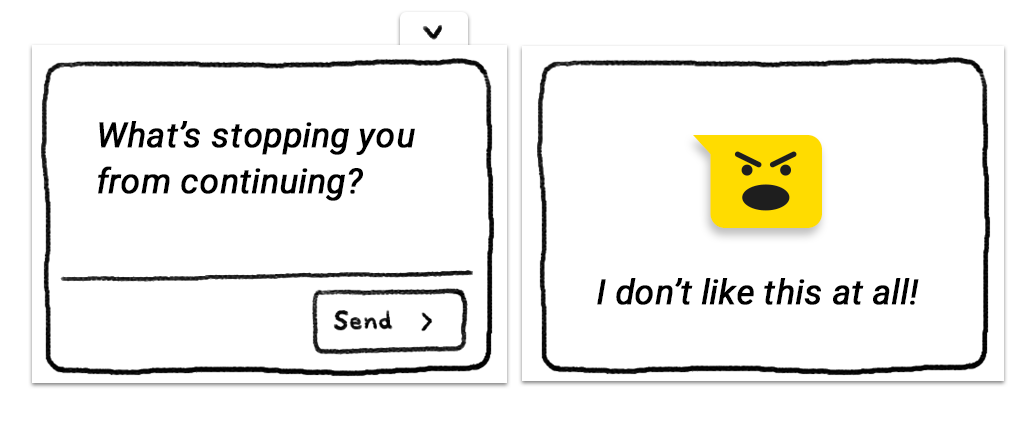
Feedback
User behavior analysis helps get a ton of information about how a cohort of users use a product. However, real user feedback by asking them is often a great way to corroborate analysis results. These feedback mechanisms can be in the form of quick pop-ups (as shown below) and help understand pain-points, frustration moments, and why they choose to leave if they do so.
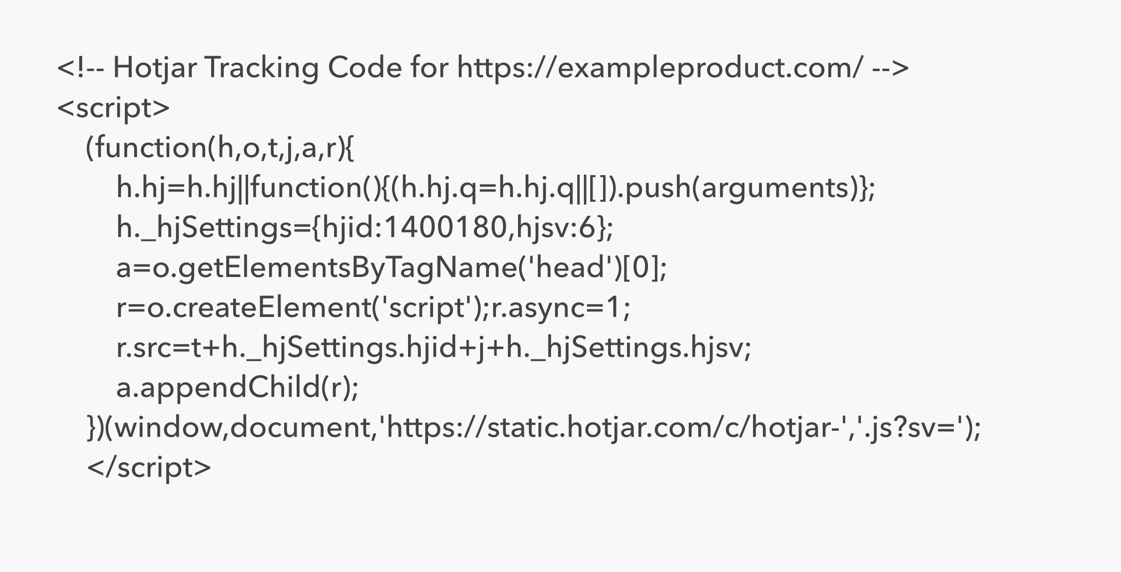
Installing Hotjar
We need to add a Hotjar snippet in the <head> tag as given below and that should be sufficient.
Conclusion
Hotjar is a straightforward application to use and integrate with your product. It offers easy ways to gather data about your product usage. This valuable data can be used to make data-guided decisions that can be presented to higher management and relevant stakeholders. This analysis can also provide the right path for the continued development of the product in a way that adds value to its users. If you enjoyed this post, here are a few more that may interest you,